Industry News
When it comes to wear debris analysis, ferrography and spectrometric analysis are two of the most commonly used techniques in lube oil analysis. Both help assess machine wear and both offer real diagnostic value, but they serve different purposes and reveal different aspects of what is happening inside the equipment.
The practical difference is this: spectrometric analysis is primarily a screening tool for measuring fine wear metals and contaminants in suspension, while ferrography is a diagnostic tool for examining the size, shape and character of wear particles to understand active wear modes and severity. Spectrometric methods are fast, repeatable and routine. Ferrography is slower, more interpretive and far more revealing when abnormal wear is suspected.
A well-run oil analysis program does not rely on a single wear test. Different wear mechanisms produce different particle sizes, and no one method captures the full picture. Front-line wear screening commonly includes elemental analysis, particle count and ferrous density, while deeper root-cause investigation often requires microscopic wear debris analysis, such as ferrography. These methods are most powerful when used together rather than as substitutes.
This matters because size matters in wear detection. Some early wear modes produce extremely fine particles that are well suited to elemental spectroscopy. More severe or active distress often generates larger particles, and these may be poorly represented — or entirely missed — by routine spectrometric methods.
Spectrometric analysis, often performed using ICP or RDE techniques, measures the elemental concentration of metals and certain contaminants in the oil. In routine used oil analysis, it is one of the most useful and widely used tests because it quickly detects fine wear metals such as iron, copper, lead, chromium and aluminium, along with additive elements and some contaminants.
Its strength lies in trending. If iron begins to climb sample after sample, or if copper and lead begin to rise together, the pattern can point to developing wear in specific components. Spectrometric analysis is especially effective as a routine surveillance tool because it is fast, standardised, and easy to trend over time.
The main limitation is particle size. One widely cited drawback of ICP spectroscopy is that it generally does not detect particles much beyond roughly 3 to 5 microns because larger particles are not effectively vaporised in the test. That means spectrometric results can under-represent severe wear conditions that generate larger debris.
This is why a machine can be actively generating large wear particles while the elemental numbers still look only moderately elevated. For that reason, experienced analysts do not treat spectroscopy as a complete wear diagnostic on its own.
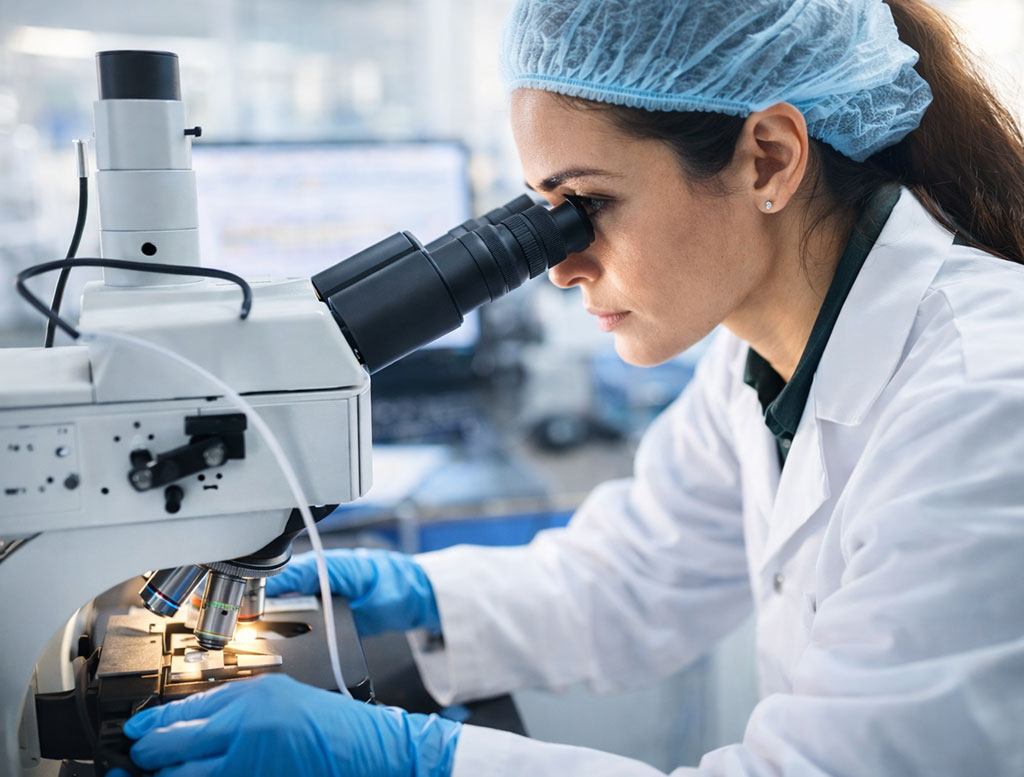
Ferrography is a wear debris analysis technique that separates particles from an oil sample and allows them to be examined microscopically. In analytical ferrography, the sample is passed over a specially designed slide under a magnetic field, causing ferrous particles to deposit along the slide. The analyst then studies the ferrogram under a microscope to assess particle size, shape, texture, colour, and concentration.
The value of ferrography is that it goes beyond “how much metal is present” and moves into “what kind of wear is occurring?” It can help distinguish cutting wear, sliding wear, fatigue wear, corrosive wear and severe distress. It also has strong sensitivity to larger particles and active machine wear, which makes it especially useful when wear is already progressing beyond the fine-particle stage.
A simple way to think about it:
That is why ferrography is often described as a more forensic or root-cause-oriented method, while spectroscopy remains the backbone of routine trend monitoring.
Spectrometric analysis is usually the right first-line test when you need:
For most oil analysis programs, this is the everyday workhorse test. It is efficient, scalable and very good at identifying changes in fine metallic debris before those changes become obvious in operation.
Ferrography becomes especially valuable when:
It is particularly useful for high-value or failure-critical equipment where understanding the mode of wear can change the maintenance response. Rather than just confirming that wear exists, ferrography can help determine whether the problem is abrasion, rolling fatigue, boundary lubrication distress or severe sliding.
The most effective wear monitoring programs do not choose one and discard the other. Spectrometric analysis is excellent for routine trending, while ferrography is excellent for detailed diagnosis. One identifies an abnormal pattern; the other explains it.
That layered approach is consistent with long-standing wear debris analysis practice: screening tests such as elemental analysis, particle count and ferrous density are used to flag developing problems, while deeper microscopy-based methods are used to characterise the particles and support root-cause diagnosis.
This is where experienced analysts separate themselves.
Spectrometric analysis may miss:
Ferrography may be weaker for:
In other words, spectroscopy is better for breadth and trending, while ferrography is better for depth and interpretation.
For most assets, the answer is not “either/or.” It is use spectrometric analysis routinely, and use ferrography when conditions justify escalation.
A practical strategy looks like this:
That is the most efficient way to balance cost, speed and diagnostic power.
Understanding the difference between ferrography and spectrometric analysis is essential for building an oil analysis program that does more than generate reports. The right combination of routine screening and deeper wear debris diagnostics can identify abnormal wear earlier, improve root-cause investigation and help prevent costly equipment failure.
Atlas Lab provides advanced lube oil analysis services designed to assess lubricant condition, contamination, and wear with the level of detail your equipment demands. Whether the requirement is routine wear metals trending or deeper wear particle investigation, Atlas Lab helps convert oil data into practical maintenance intelligence.
Reach out to Atlas Lab for reliable oil analysis support tailored to your asset criticality and reliability goals.
Phone :+91 9324631646
WhatsApp : +91 9324631646
Email : contact@atlaslab.in
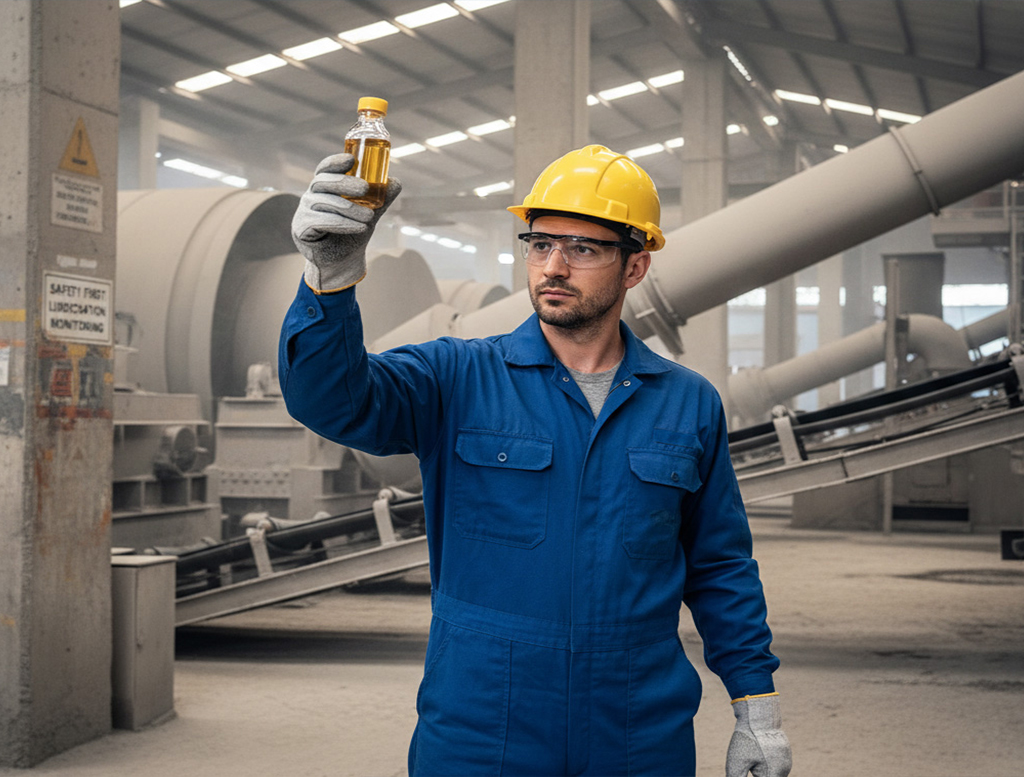
The cement industry operates under some of the harshest conditions in industrial manufacturing. Equipment such as rotary kilns, vertical roller mills,
Read more about Lube Oil Testing for the Cement Industry
The steel industry operates some of the most demanding and high-load machinery in the industrial sector. Equipment such as blast furnaces,
Read more about Lube Oil Testing for the Steel Industry